
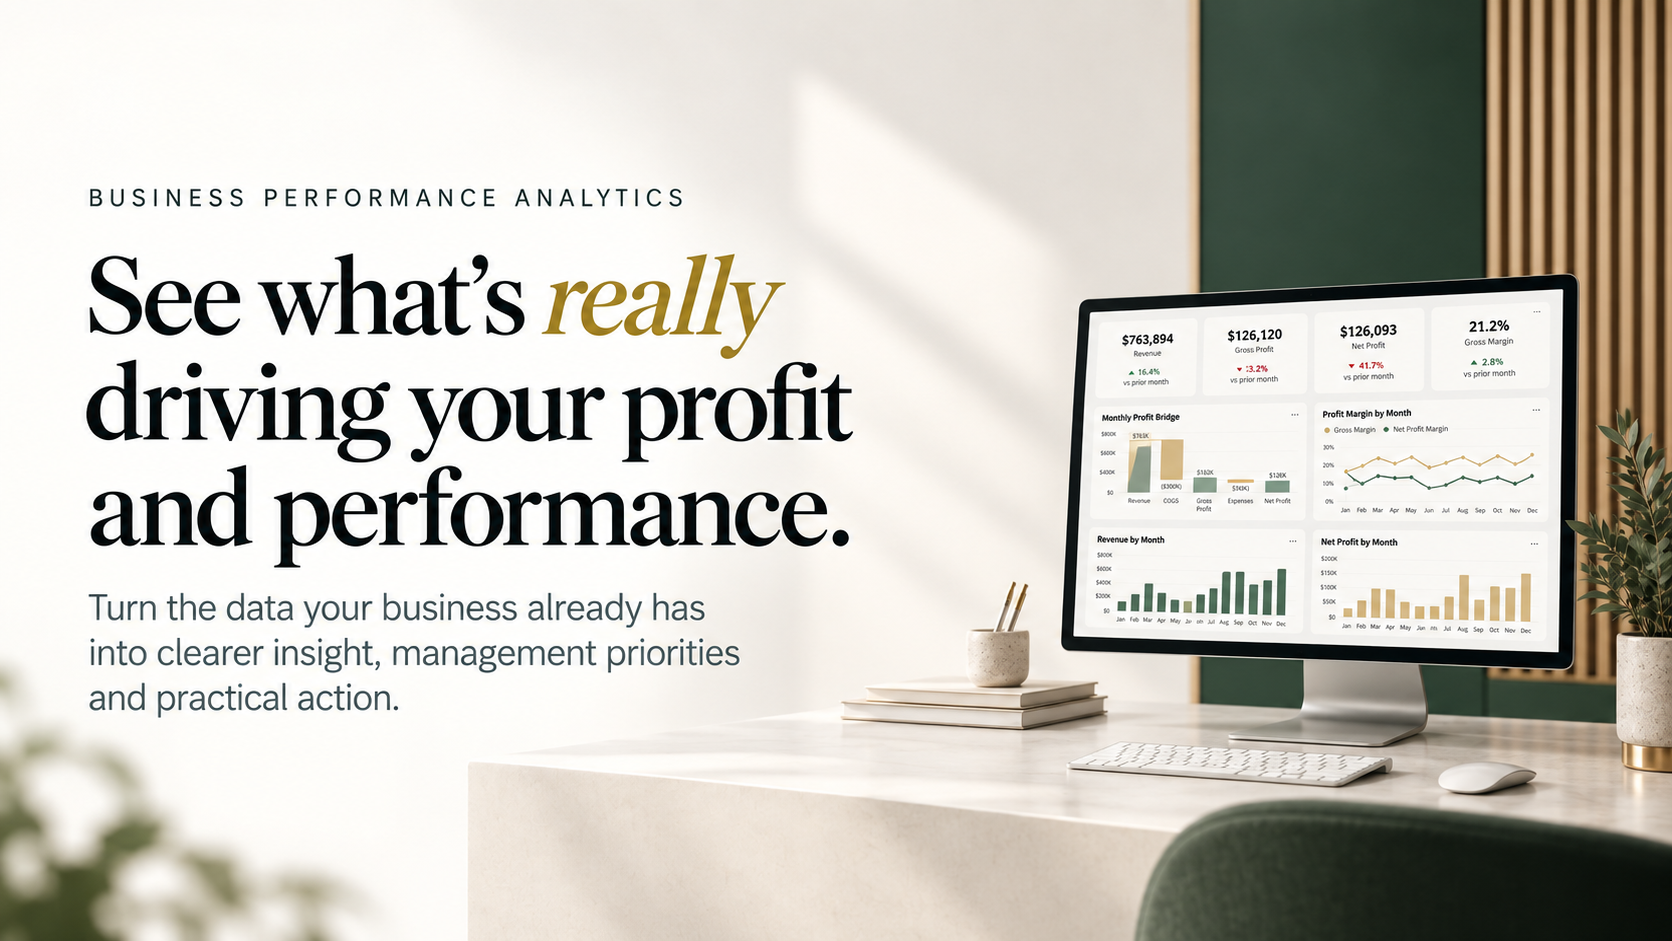
For businesses that have outgrown basic reporting
As your business grows, understanding performance becomes harder.
You may already have accounting reports, operational systems, CRM data and spreadsheets, but still struggle to see what is driving profit, cost and performance.
Growing Complexity
More customers, products, people, costs and systems make performance harder to understand.
Limited Visibility
The data exists, but management cannot easily connect the numbers or explain what is driving change.
No Internal Analytics Team
You need deeper analysis and better reporting, but a full-time analytics function may not yet make commercial sense.
Does any of this sound familiar?
- Revenue is growing. Profit isn’t. Sales can look healthy while margin quietly disappears through pricing, discounting, product mix, freight, labour or other costs.
Costs are increasing, but the real drivers aren’t clear. You can see the result, but not easily explain what is causing it.
Reports tell you what happened, not why. Management still has to ask what changed, why it changed and what deserves attention.
The questions your data should help you answer
- Why is profit moving differently from revenue?
- Which customers, products or services create the most value?
- What is really driving the increase in costs?
- What deserves management attention first?
From business question to management action
We analyse the relevant data, turn it into clear business insight, identify the drivers and translate the findings into management priorities.
Question → Evidence → Insights → Drivers → Priorities → Action
How Generous Group Can Help
- Business Performance Analytics. Understand what is driving revenue, margin, cost and operational performance.
- Executive & Management Reporting. Turn business information into concise, decision-ready reporting.
- Cost & Profitability Analytics. Identify where profit is created, where margin is being lost and what is driving cost-to-serve.
Selected Work
- Enterprise Workforce Reporting. Aligned HR and Finance definitions into one trusted workforce reporting view.
- Sales Performance Dashboard. Brought key sales measures and trends into a clearer decision-ready view.
- SaaS Metrics Dashboard. Structured recurring-revenue metrics into a concise executive performance dashboard.
Not sure what the data is really telling you?
Tell us what you’re trying to understand, profit, costs, customers, performance or reporting, and we’ll discuss whether focused analysis can help.